The technical patterns on long-dated treasuries suggest rising yields. What about fundamentals?

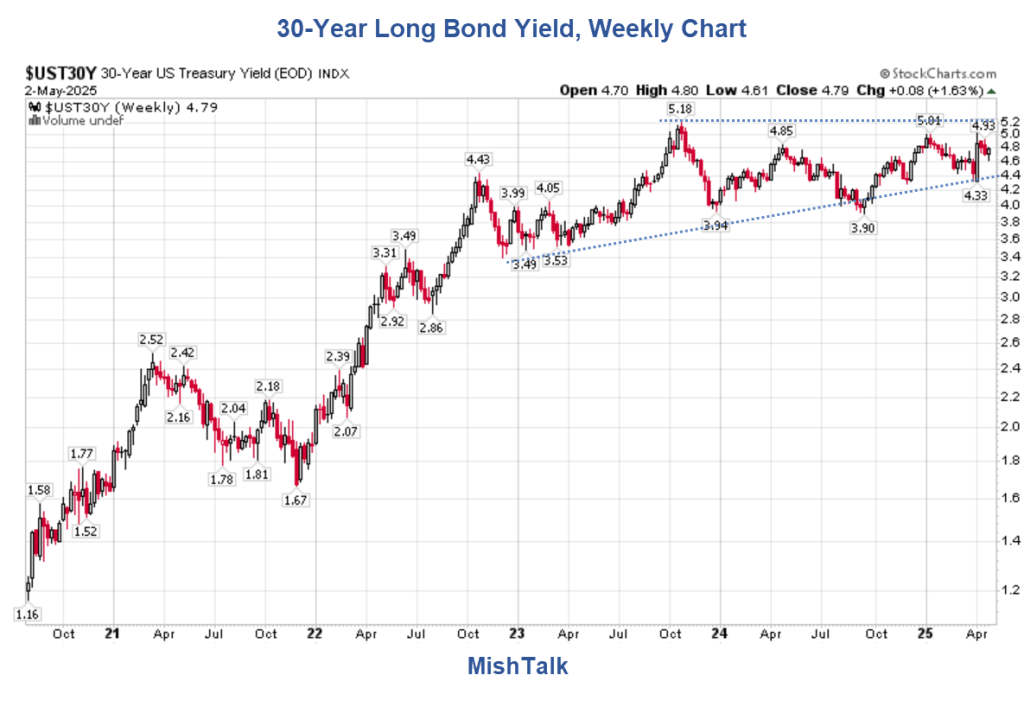
30-Year Long Bond Yield, Weekly Chart

10-Year Treasury Note Yield, Monthly Chart

10-Year Treasury Note Yield, Weekly Chart

Ascending Triangles
An ascending triangle is a bullish chart pattern that signals a potential breakout and continuation of an uptrend. It’s formed by a horizontal resistance line (connecting multiple highs) and a rising support line (connecting higher lows). The pattern suggests buyers are becoming increasingly strong, indicated by the higher lows, and may soon break through the resistance level.
Long-Term 10- and 30-Year Treasury Yields

Technically Speaking
These charts are very clear. And they are quite ominous for Treasury bulls.
Technicals don’t always play out according to expectations. So what do the fundamentals say?
Posts Regarding Fundamentals
February 10, 2025: Federal Deficit Is Up $306 Billion Compared to Same Period Last Year
The US deficit for the first four months of fiscal Year 2025 is $838 billion, up $306 billion. Adjusted, the increase is more like $157 billion to $225 billion.
March 27, 2025: US Debt Will Grow to a Staggering 156 Percent of GDP by 2055
If Congress extends the TCJA tax cuts with no offsetting savings, the deficits will surge.
May 2, 2025: Consumers Face End of De Minimis Tariff Exemptions on $800 Packages
The trade provision that allows consumers and resellers to avoid duties on shipments worth $800 or less is ending for products made in China.
Hooray!? 40% to 100% Higher Prices
Who wants that? (Exclusions for cultist parrots who cannot think).
April 9, 2025: Trump Promises $1 trillion in Defense Spending for Next Year
Even bigger budget deficits are now in store due to the first $1 trillion defense budget.
April 5, 2025: Trump Wanted a Weaker Dollar, Wish Granted, Euro Highest Since 2021
Futures are in a nasty mood tonight except for a new record high in gold.
May 1, 2025: GM Expects $4 Billion to $5 Billion in Tariff Costs this Year
Tariffs will wipe out up to a quarter of GMs’ net profit for the year.
April 5, 2025: Trump Sides With Elizabeth Warren, Won’t Sign a Bill That Cuts Medicaid
What a fiscal joke the Republican party has become.
April 30, 2025: Real GDP Down 0.3 Percent, Real Final Sales Down 2.5 Percent, Inventories Soar
Front-running tariffs led to a collapse in real final sales, the bottom-line estimate of GDP
Fundamental Synopsis
- Negative 0.3 percent GDP, Negative 2.5 percent Real Final Sales
- US Dollar Down 9.0 Percent This Year
- Deficit Is Out of Control
- Tariffs are slowing the economy and raising prices
- Republicans are unwilling to cut entitlements
- Trump wants more tax cuts that will increase the deficit
Long-term yields are high for fundamental reasons and the technicals match.
What to Expect
Anything, near term.
No one knows if Trump tariffs will collapse the economy enough to compensate for the stagflationary look of GDP.
Even if so, the long-term picture for long-term bonds is not good.